
In the midst of a war between Ukraine and Russia, opinions among investors were confused as to whether Bitcoin could outperform the rest markets crisis.
Specifically, a percentage of the order of 63% among the investors and traders, believed in free fall of the price of Bitcoin and generally in free fall of Cryptocurrencies Market.
Watching January 2022, to close in red, watching the start of war in Ukraine and seeing the whole world impose sanctions to Russia, the estimations about a possible crash, there were more.
Paying attention to the Investments in Bitcoin Futures and Ethereum Futures, from February end until March end, we could easily understand that the expectations of Investors were for the downside, as the investors were closing their long positions. Specifically, we were having a decrease of 9.55% in the long position of Bitcoin during March.
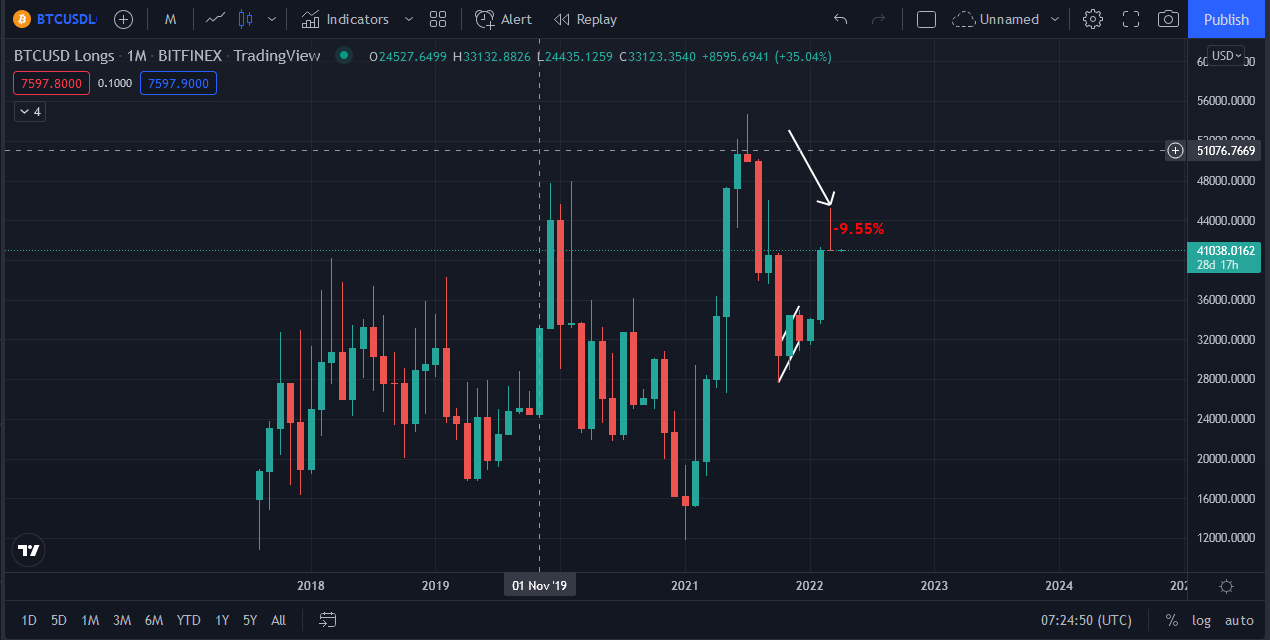
Description: BTC/USD Longs – March 2022 (Monthly Time Frame)
The second biggest Cryptocurrency, Ethereum, saw losses of 62.88% according to Bitfinex .
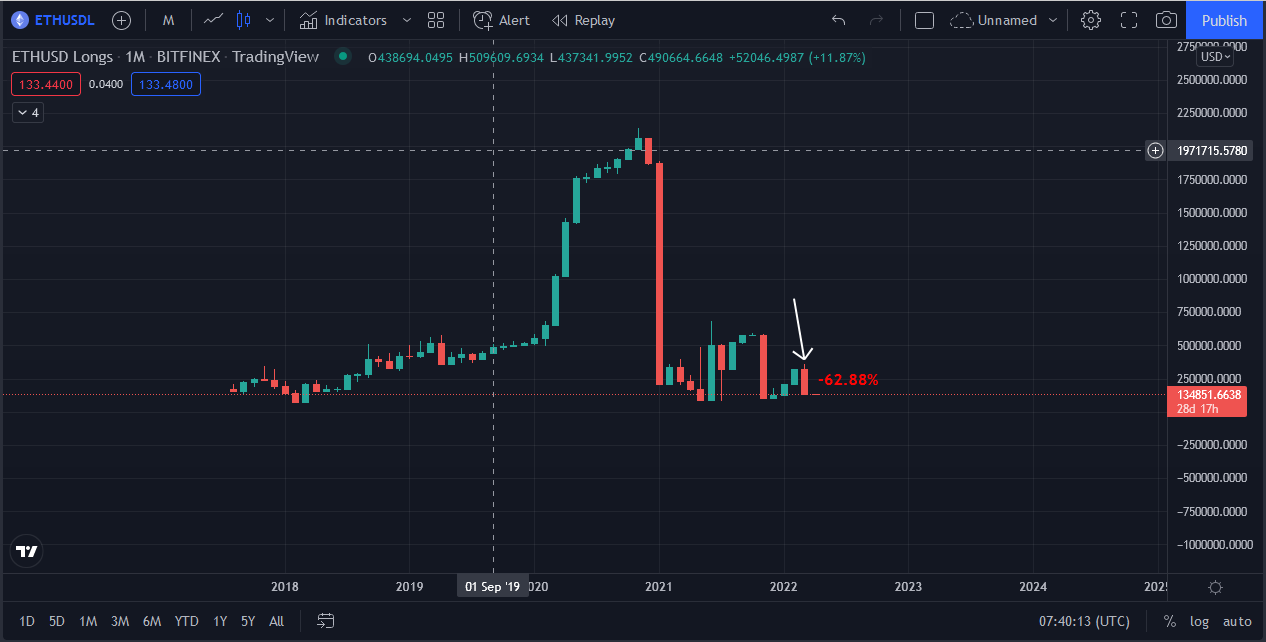
Description: ETH/USD Longs – March 2022 (Monthly Time Frame)
In the other hand, Litecoin expressed the exact opposite picture from Bitcoin and Ethereum, by attracting the interest of Investors. More concrete and always according to Bitfinex, we had an amazing increase for the Long Position by 40.52%.
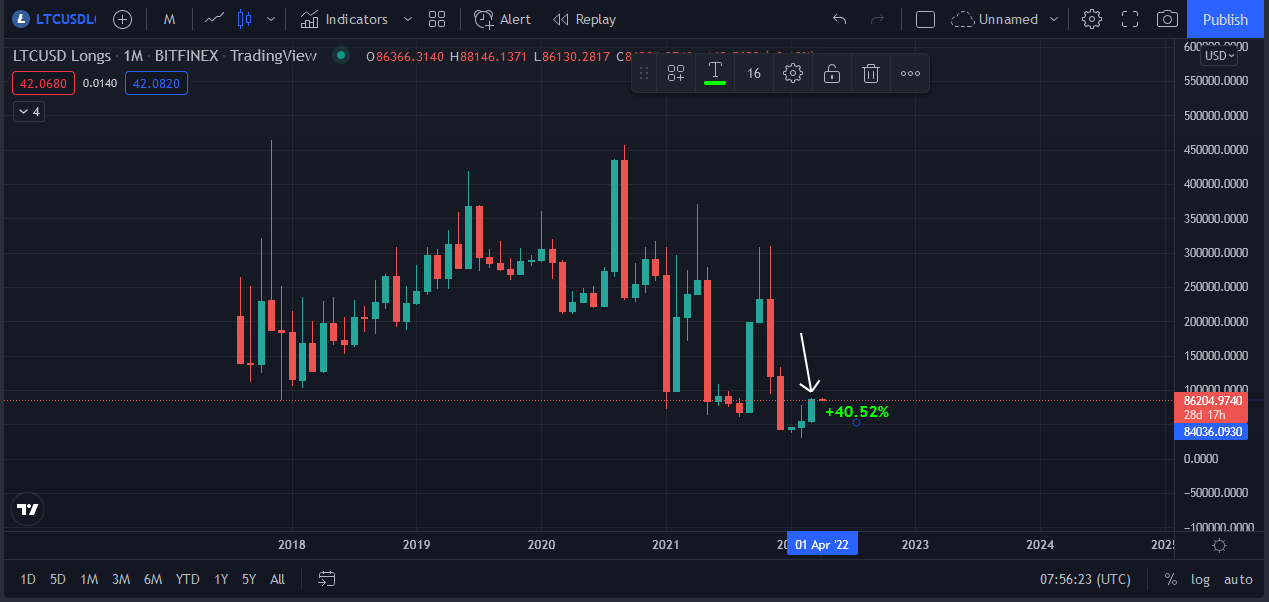
Description: LTC/USD Longs – March 2022 (Monthly Time Frame)
The explanation we can give about this separation of Litecoin from the two leading Cryptocurrencies has to do with the factor of the Ukraine and Russia war. Explaining this further, we need to mention that Litecoin belongs to the category of favorite Altcoins in Ukraine and Russia. In those two countries, we have thousands of Litecoin miners. Also, the factor of transaction fees, compared with Bitcoin and Ethereum, are lower. This helps a lot, people to transact more in Litecoin, rather than the two leading Cryptocurrencies, by avoiding the expenses of transaction fees. Lastly, it seems to be that Litecoin increased its usage during the war period, as we had plenty of Donations in Litecoin, to the Ukrainian Humanitarian System.
Summarizing the above info’s, we are in position to say that the difficulties are existing at the moment in Ukraine and in Russia for people to transact money across the world, works beneficially for Cryptocurrencies and that’s was the main reason we saw this recovery on Cryptocurrencies prices. The sanctions against Russia were a catalyst factor for this crypto increase. This factor works against the technical analysis expectations. For this reason, as Investors and traders, we need to take in account all the news and fundamentals around Cryptocurrencies before making any decision.
Technical Perspectives for Bitcoin, Ethereum and Litecoin
Bitcoin Technical Analysis
As we mentioned in our fundamental and news analysis, Bitcoin reclaims all its losses from January 2022, until March 2022.Now, the focus of traders is shifting to April, Which has historically been a powerful month for Cryptocurrencies. According to historical data Bitcoin closed the April month in red, only in three cases. The worst price action of Bitcoin for April month was in 2015 when it recorded monthly losses of 3.46% in 2015.
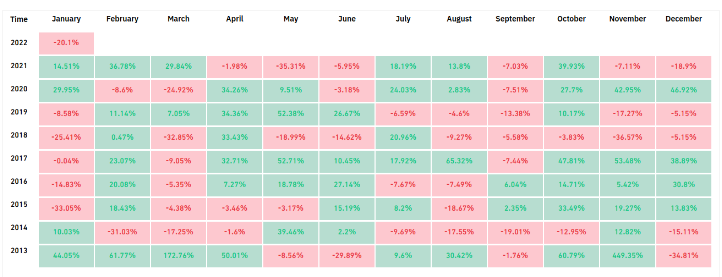
Description: Bitcoin Monthly Price Action from 2013 until 2022
From the technical perspective and only, and by analyzing the Bitcoin Price action on the monthly time frame, we can expect the following:
According to the Moving Averages
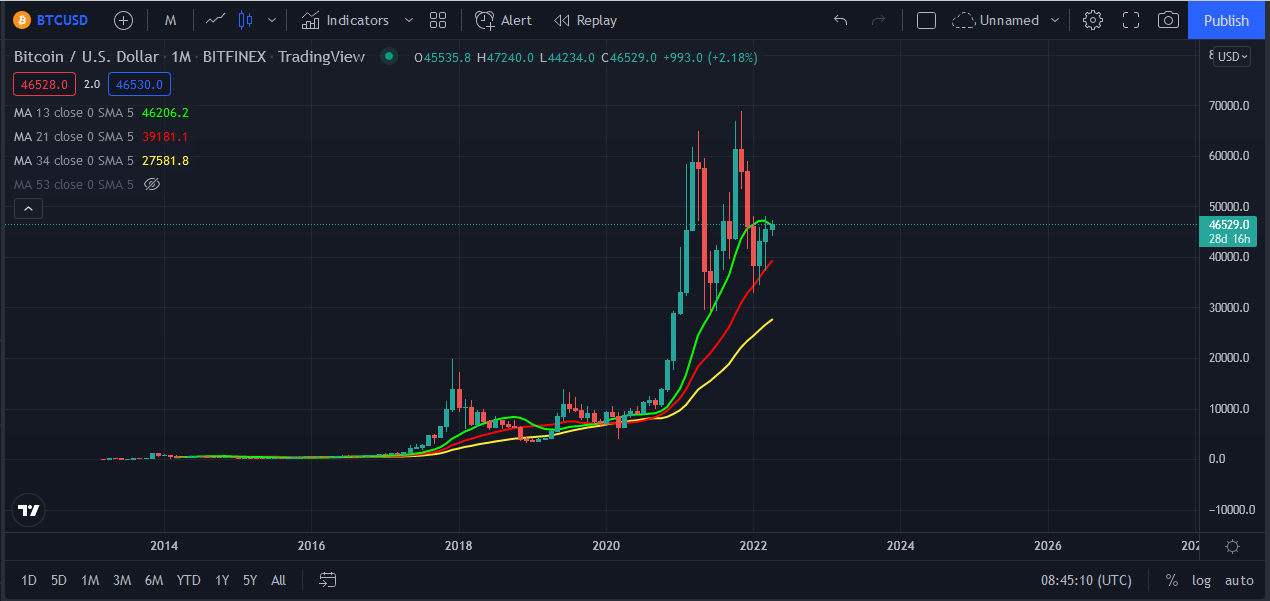
Description: Bitcoin Moving Averages
According to the Moving Averages, it is clearly that Bitcoin is going to fight with 13 Moving Average on Monthly Time Frame, which at the moment is a strong resistance indicator. The target for Bulls is to break above this area and at the same moment to find support.
The Yearly Trend – Line
The $46,500.00 area is a key area for Bulls and Bears either. Apart from the 13 Moving Average, exactly in this area, we are having a Long Term Trend – Line, which it react as a strong resistance too.
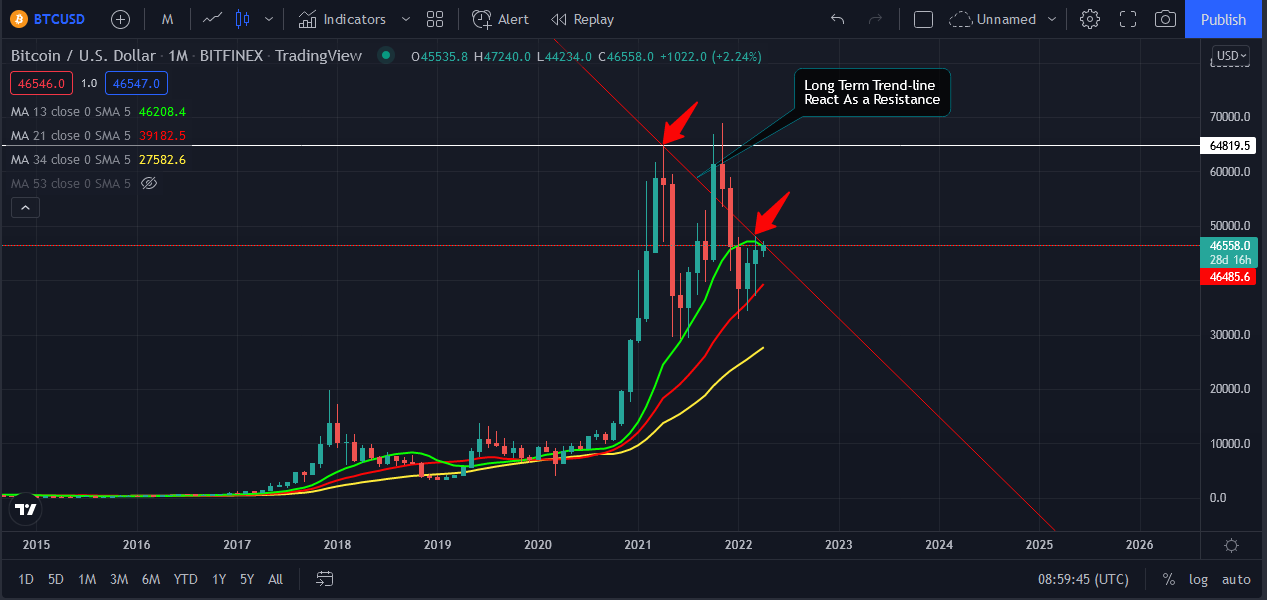
Description: Yearly Bitcoin Long Term Trend – Line (From 1st of April 2021)
The Monthly ADX and DI
The ADX and DI are a key indicator and a very important factor when we are analyzing a long term time frames. Specifically, this indicator it shows the strength of Bulls, the strength of Bears and the strength of trend.
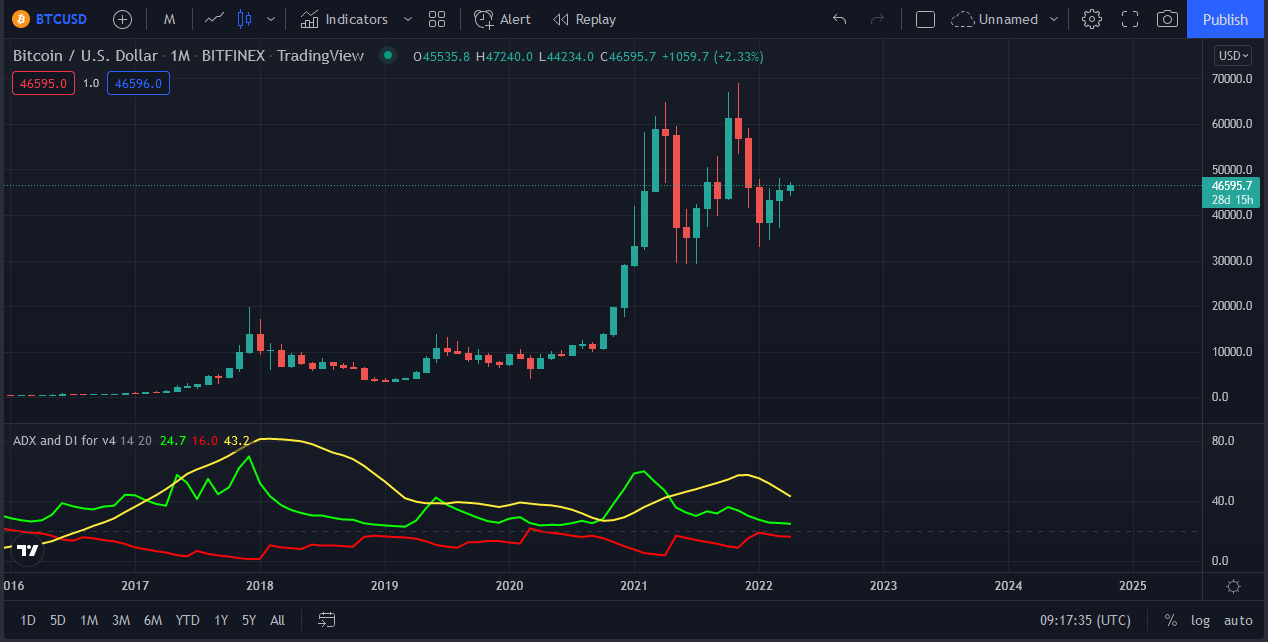
Description: ADX and DI indicator
Looking carefully the behavior of this indicator and comparing this behavior with 2017 correction (Bear Market), we can see the following similarity:
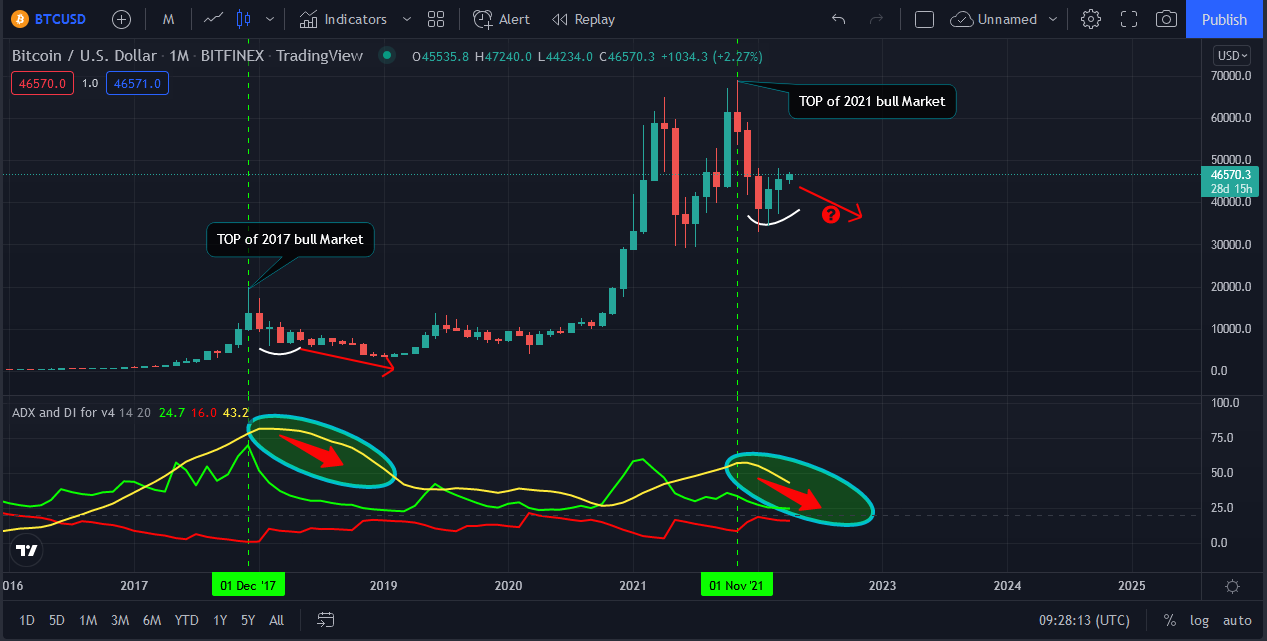
Description: ADX and DI indicator in 2017 and 2021
In 2017, when Bitcoin reached its All Times High we spot a decrease of the Bulls Strength, (Green Line) and at the same moment, a decrease on the power of trend (Yellow Line).
In 2021, when Bitcoin reached its All Times High, we notice exactly the same situation. Rabidly decrease of Bulls Strength, and at the same moment, decreasing on the power of trend.
Also, after the end of 2017s bull market, during the correction, we saw a small recovery in price action of Bitcoin, before the bear market takes place. (White curve) Exactly the same we are watching at the moment in Bitcoin price action.
Is very important to specify that, in the small recover in price action of Bitcoin in 2017, gave an end the trend – Line from the All Time High. At the moment we are writing this article, Bitcoin is testing the Yearly Trend – Line of April 2021.
In 2017, Bitcoin recovery ended by get rejected from a specific trend – Line (Tops Trend – Line).Watching the similarities of on ADX and DI indicator, we need to pay attention at the current price action, because Bitcoin has the particularity to repeat its history.
The Fibonacci Golden Ratio Supports and Resistances
Before to complete our Bitcoin Technical Analysis, we consider necessary, to pay attention into the Fibonacci Golden Ration Supports and Resistances.
When we have to do, with a long term technical analysis, it is must to check the Fibonacci Golden Ratio.
According to the trading rules, one stock or asset, it considers sustainable or unsustainable, only if it test and retest, it’s Fibonacci Golden Ratio Lines. (Support and Resistance)
When a stock or asset has increasing of its price, without testing those important supports and resistances exist the danger of flash crash.
Unfortunately for the bulls, at the moment we are in position to speak about an unsustainable increasing of price.
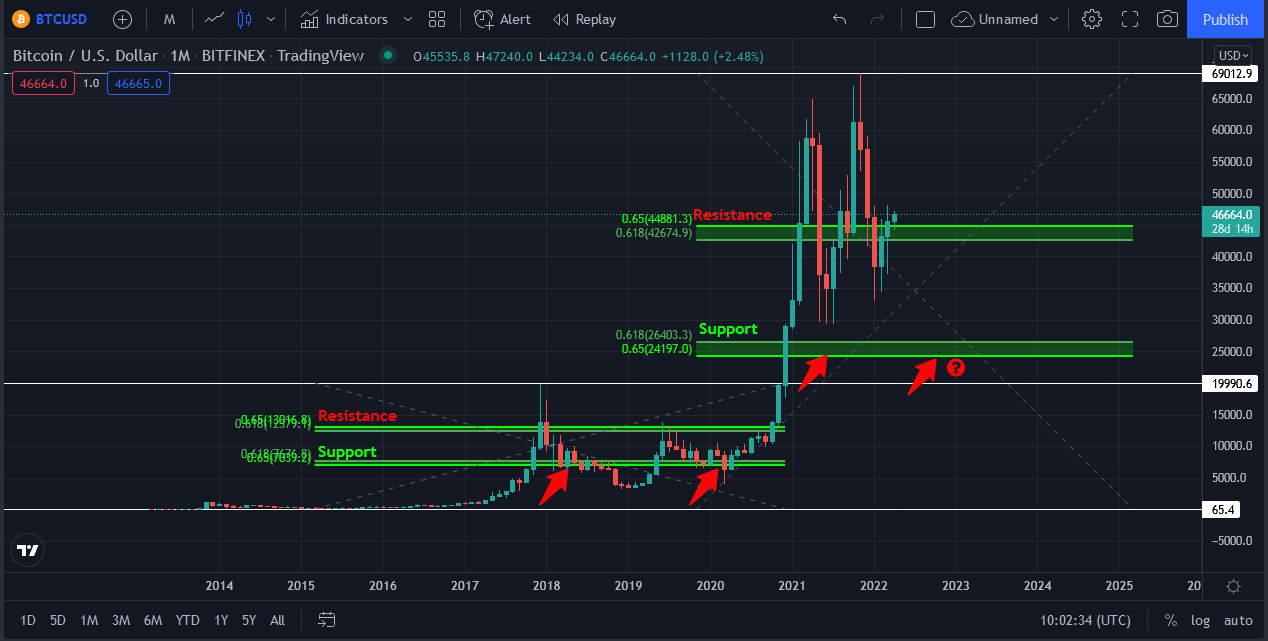
Description: Fibonacci Golden Ratio Supports and Resistances
In the above chart, we are mentioning the Fibonacci Golden Ratio Supports and Resistances, for 2017 and 2021 Market Cycles.
It is easily to understand that, in 2017, Bitcoin tested and retested its Fibonacci Golden Ration Support and resistance, twice, before to start a new Market Cycle. This event, allowed Bitcoin to have an amazing sustainable Bull Run.
In the Market Cycle of 2020 – 2022, we are noticing that Bitcoin never tested its Fibonacci Golden Ratio Support Area. Automatically this means that soon or later, Bitcoin will test its Fibonacci Golden Ratio Support, at the area between $24,000.00 and $26,500.00.
Summarizing all the above technical info’s and signals and taking in account news and fundamentals, we can say that at the moment we are in a very important bend for Bitcoin and Cryptocurrencies Market.
From one side, we have the fundamentals to support the Bitcoin price action, from other side we have one Market Cycle which is unsustainable.
In such kind of cases needed Investors and Traders to have an excellent knowledge of Risk Management.
Historically, when we had unsustainable market cycles, we saw dangerous flash crashes (See 1929 Market Crash). We need to clarify to ourselves, which category of Investors or Traders we are. If you are in the category of Investors, whom they invested based on fundamentals, then is the correct moment to invest in Bitcoin. If you belong in the category of Technical Investors, then you must wait the price to correct further. The Investors whom at the moment belong to both categories, they are sitting in the corner and they are waiting the moment that Market will give the real Investment Signal.
Ethereum Technical Analysis
Comparing with Bitcoin, Ethereum is in a better position at the moment. On the monthly Time Frame, indicators are much more positive than Bitcoin and bulls have all the rights to feel confident. Before to proceed further in our Ethereum Technical Analysis, I would like to remind that in 2017 and once Bitcoin started its major correct, Ethereum together with Ripple, outperforms Bitcoin by having an amazing rallies. We will not be surprised if in process we will see the same scenario and a repeating of history.
Ethereum Monthly Moving Averages
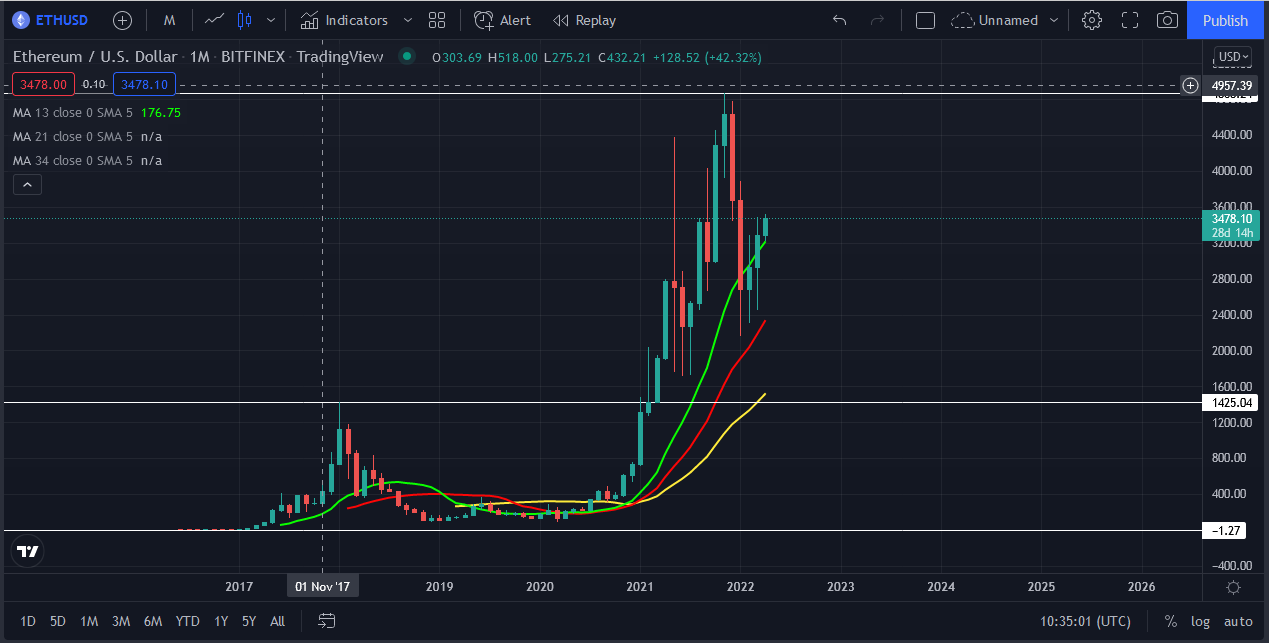
Description: Ethereum Moving Averages
Having a look at the Monthly Moving Averages for Ethereum, we can see that the price action is in a better position than Bitcoin. Ethereum Bulls, they manage to break above 13 Moving Average on Monthly Time Frame. We can also spot that they tested 13 Moving Average already once, and they have an excellent support reaction from it.
The Fibonacci Golden Ratio Supports and Resistances for Ethereum
Taking in account that Ethereum tested and retested once its Fibonacci Golden Ratio Support and Resistance, we are in position to confirm that we are speaking about one sustainable price action.
At the moment, Ethereum Bulls are fighting to break above the Fibonacci Golden Ratio Resistance. If this happen, we will be able to speak about a new possible Bull Run for Ethereum.
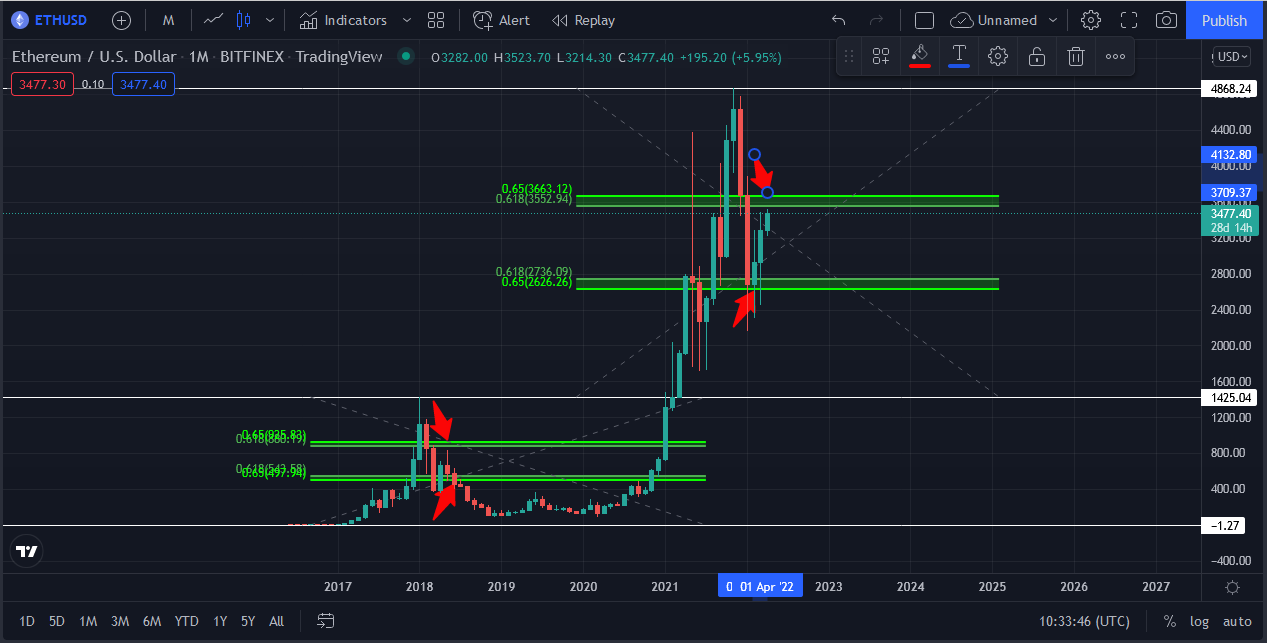
Description: Ethereum Fibonacci Golden Ratio Supports and Resistances
Looking back in 2017, we found Ethereum making one single test to the Fibonacci Golden Ratio Support, after a single test to the Fibonacci Golden Ration Resistance and after that by following a big consolidation period, it started its new Bull Cycle.
In the chart below, we are looking for two possible scenarios for Ethereum Price action at the moment.
Ethereum Scenario 1
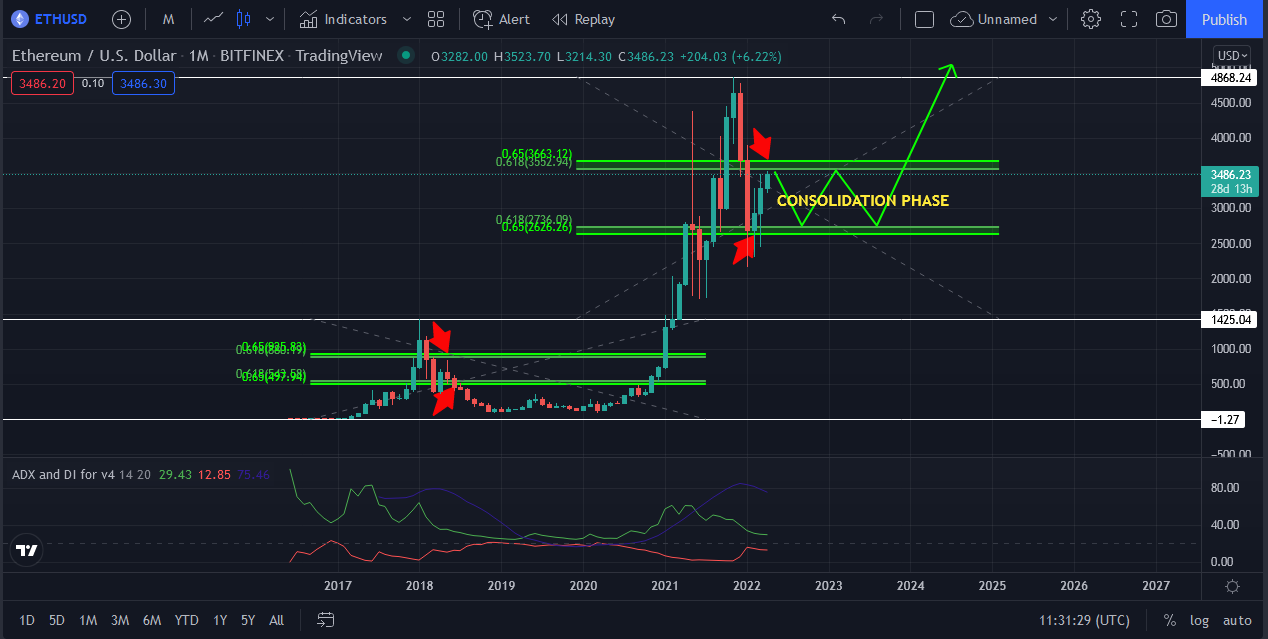
Description: Ethereum 1st Scenario
In this probability, we are expecting Ethereum to have a consolidation Phase between Fibonacci Golden Ratio Support and Resistance, before to start a new Bull Era.
Ethereum Scenario 2
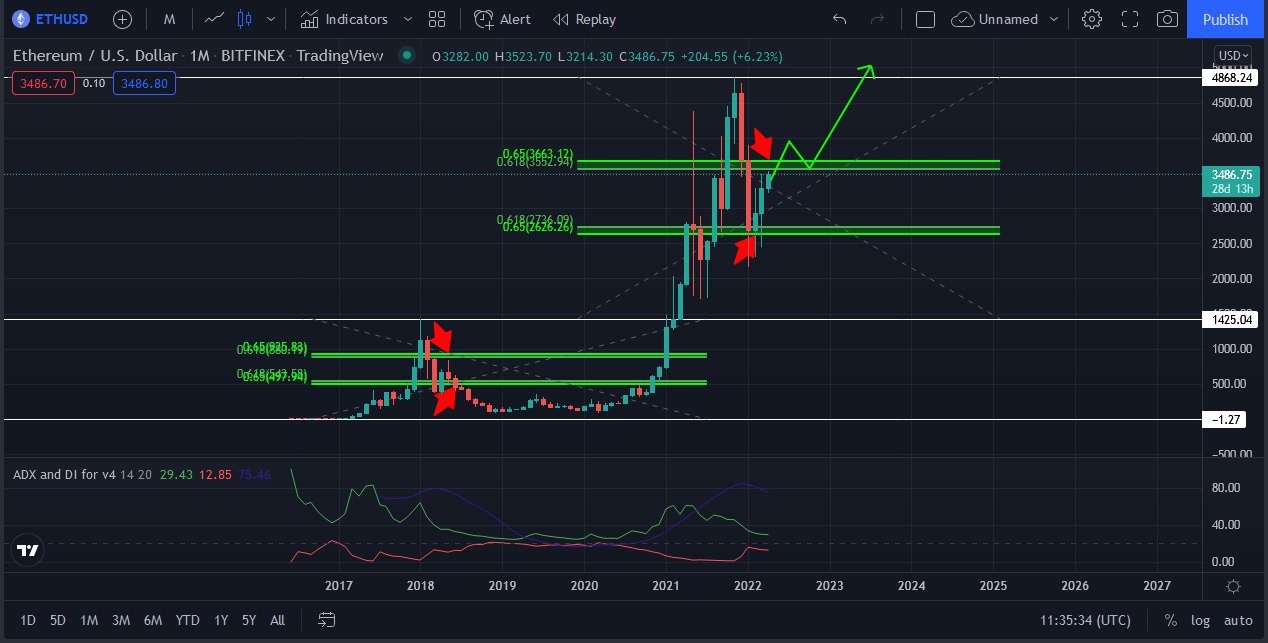
Description: Ethereum – The possibility to Repeat 2017 Rally
The second scenario is based on the historical 2017 performance. The fact that Ethereum broke above 13 Moving Average together with the Historical Outperformance of 2017 against Bitcoin, we will not surprise to see a new Bull Run above or near the previous All Time Highs of November 2021.
The Extra Beneficial Signals of Ethereum
The Trend – Line
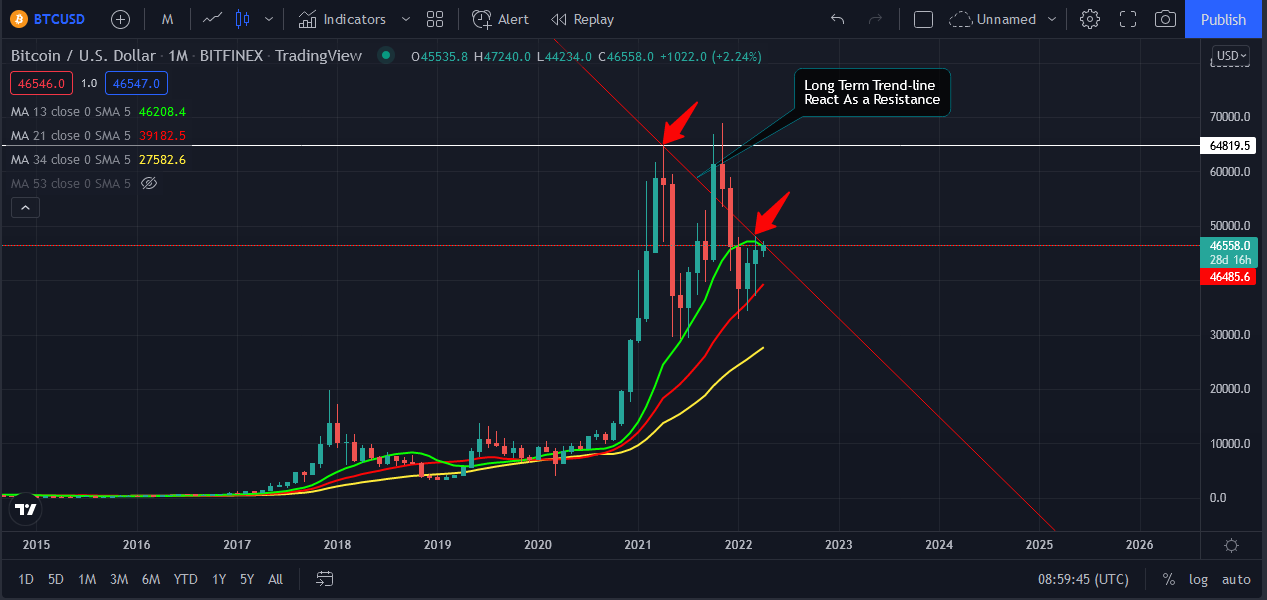
Description: Ethereum Long Term Trend – Line (From 1st of April 2021)
Unlikely Bitcoin, Ethereum it shows more strength by comparing the two Cryptocurrency in the factor of Trend – Line. At the moment we are writing this article, Ethereum is above the Yearly long term trend – line from April 2021. In the opposite, Bitcoin is fighting at the moment with the same trend.
The ADX and DI of Ethereum
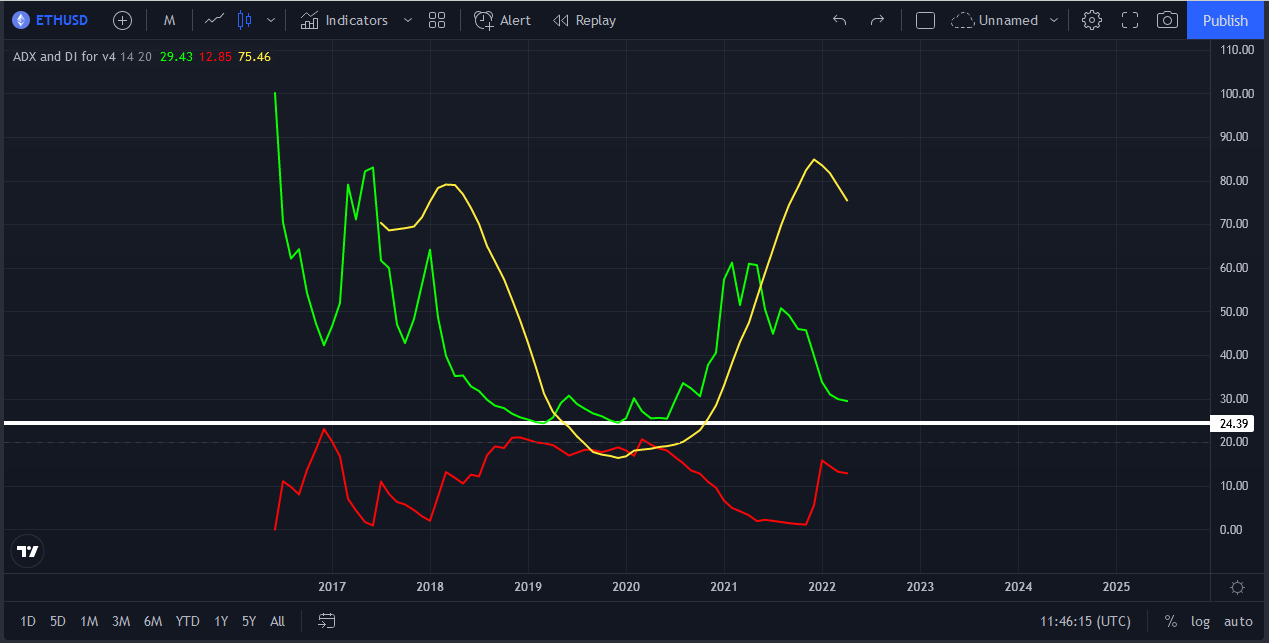
Description: Ethereum ADX and DI indicator
Comparatively with Bitcoin, ADX and DI indicator is for both Cryptocurrencies, almost the same. The Particularity here for Ethereum is that the Bullish Strength, never falls below 24.39 historically. At the same moment, Bulls Strength is near to those levels. Going back to 2019 – 2020, we see that once the Bullish Strength touches the level of white line, we have a big consolidation period, before the next Bullish Momentum. This signal, it increase the possibility to see the Scenario one (1) for Ethereum in the upcoming months.
Summarizing the above info’s, we have the following positives for Ethereum:
- Bulls are controlling at the moment the price action
- 13 Moving Average reacts as a support for Ethereum
- Bulls are above the Yearly Trend – Line
- ADX and DI indicator is near to make reset and restart of new Market Cycle
- Ethereum already tested and retested once, its Fibonacci Golden Ratio Support and Resistance
- In general, Ethereum price action is more sustainable than Bitcoin
Litecoin Technical Analysis
Maybe at the moment, news and fundamentals to favoring Litecoin, but we are not in position to say the same and from the perspective of Technical Analysis.
Litecoin is behind many leading Altcoins at the moment. Also is one of the Altcoins that it disappointed its supporters during 2021 Bull Era. The expectations for Litecoin were very high for the last Bull Market. Many Investors and traders, were expecting prices between $700,00 to $1,200.00 per coin. At the end of the day and resuming the price action of Litecoin, we saw a minimal All Times High with the price to surpass the previous All Times High of 2017, for just a few dollars.
That was a frustrated for the supporters, holders and Investors of Litecoin. For this reason, comparing with Ethereum and Bitcoin, we are in position to say that at the moment, Litecoin has the worst performance.
Litecoin Monthly Moving Average
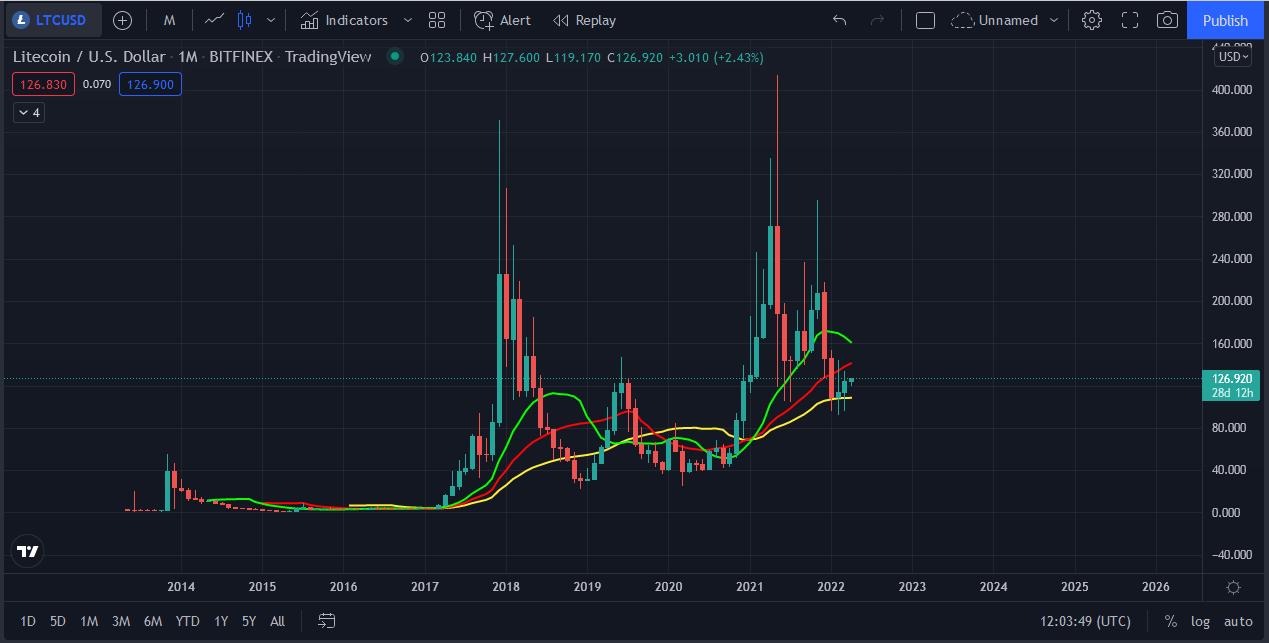
Description: Litecoin Moving Averages
The reason that Litecoin is fighting at the moment between its Moving Averages, it express the truth of our words. At the moment, the price action of Litecoin is nowhere near the 13 Moving Average and at the same moment, it is facing strong resistance from the 21 Moving Average.
Litecoin Trend – Line
Exactly the same picture, we are able to see and in the reaction of price action against the Trend – Line.
At the moment, Ethereum is above the Yearly Trend – Line of April 2021. Bitcoin is going to fight for the break of this trend – line. As we can see in the chart below, Litecoin is nowhere near to retest this Bearish Trend.
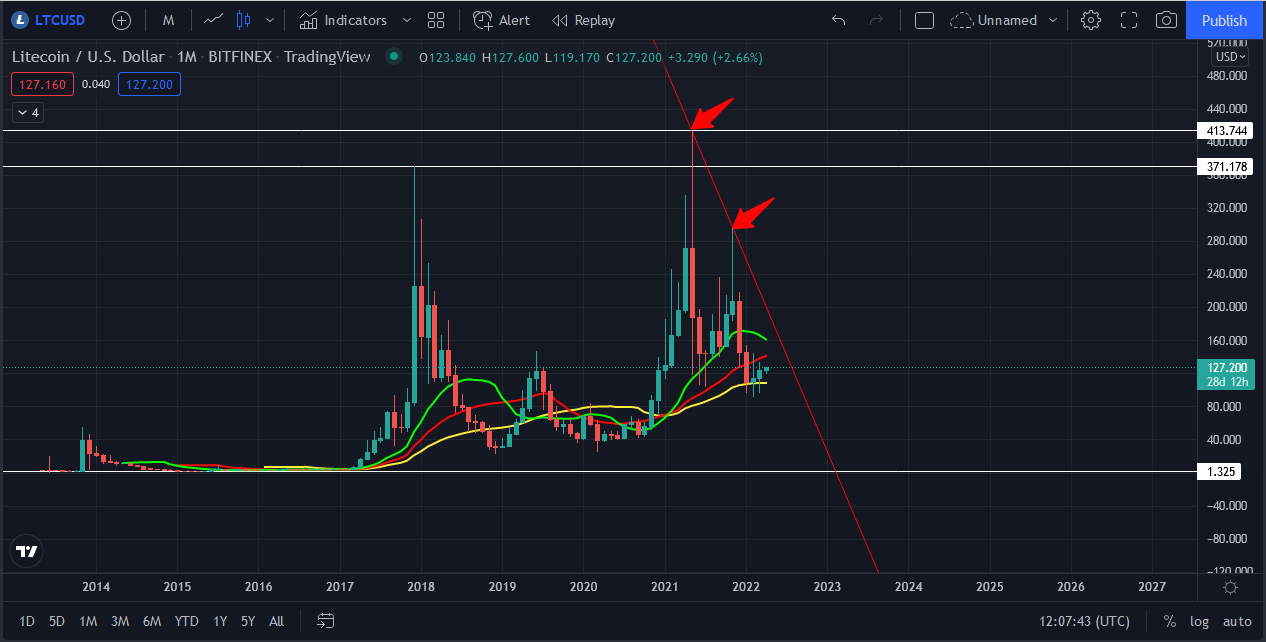
Description: Litecoin Long Term Trend – Line (From November 2021)
Litecoin Fibonacci Golden Ratio Supports and Resistances
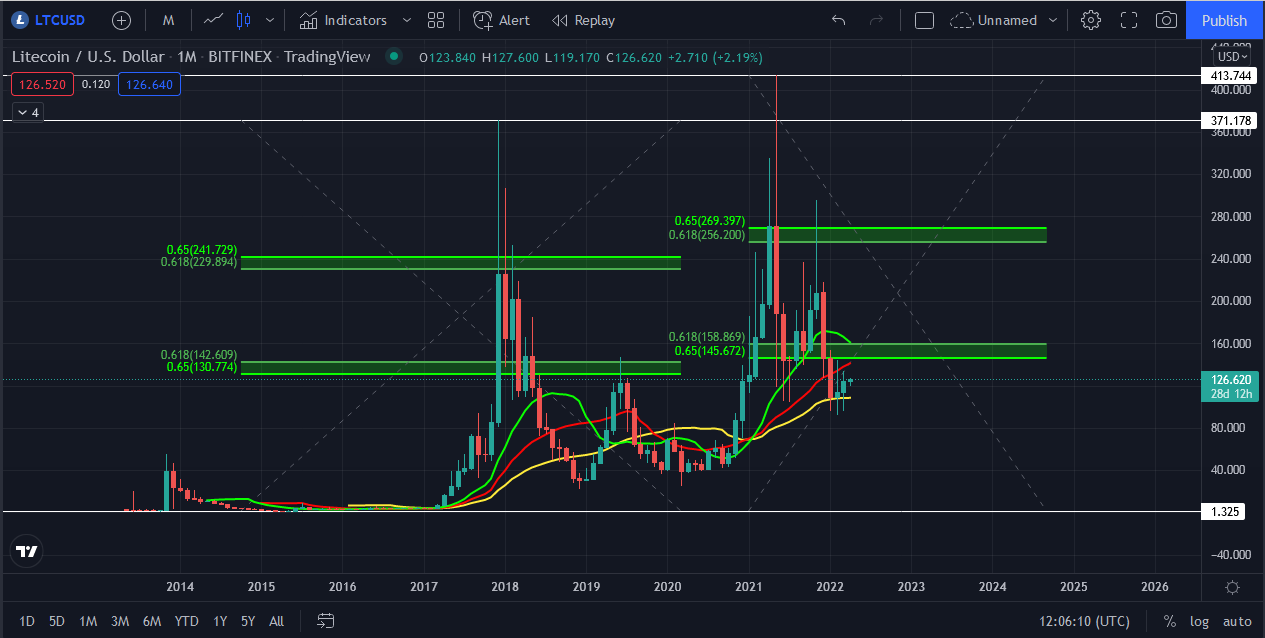
Description: Litecoin Fibonacci Golden Ratio Supports and Resistances
Based on the Fibonacci Golden Ratio Supports and Resistances, we can easily understand that Litecoin is not performing the same with Ethereum and Bitcoin. At the moment, all the historical Fibonacci Lines of Litecoin react as resistances.
This is another one bearish Technical signal we need to pay attention. Traders and Investors must wait to see the price action surpassing the Fibonacci Golden Ratio Resistance at the area of $158,00 before making any decision. In this exact price level, we are having also the 13 Moving Averages which it will react as a resistance too. This is the phenomenon of Double Resistance and usually we face this phenomenon during long term correction or Bear Cycles.
The positive Scenario for Litecoin Investors
Litecoin can raise between $180,00 to $200,00 in the upcoming days – weeks.
Beside the negative technical signals, but taking in account the positive fundamentals and news, we can see one positive technical scenario to get completed, if from other side, Litecoin continues to have the same usage during the War Situation in Ukraine.
More concrete:
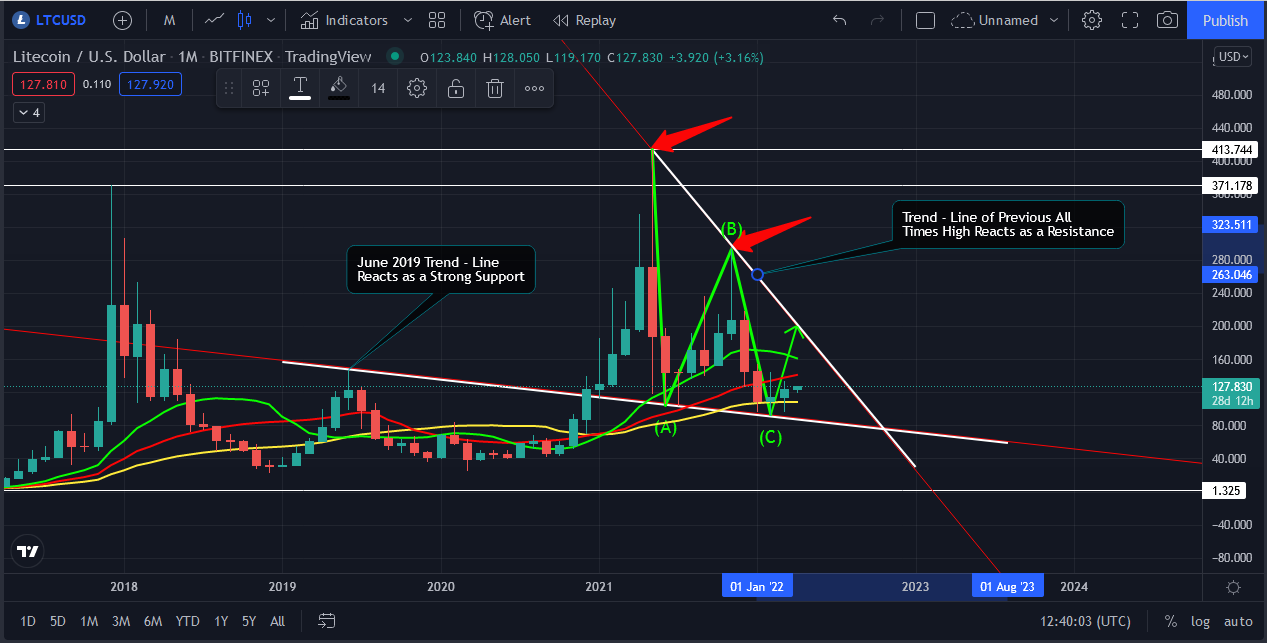
Description: Litecoin Scenario
As we can see in the above chart, the price of Litecoin found support from the long term Trend – Line of June 2019. The exact Trend, provided support to the Litecoin Bulls four (4) times. This it indicates that this area, (Between $80,00 to $130,00), is a very strong support area for Litecoin. Based on the data of this Trend – Line, once Litecoin retest this support, it creates a small Bull Run.
According to this data and taking in account that this period Litecoin is one asset that get used often through the Ukraine Crisis, we will not surprise at all, if during the upcoming days – weeks, we see the price of Litecoin around $180,00 to $200,00.
At the same moment, raising the price at those levels, Litecoin Bulls will be able once more, to retest the main Bearish Trend – Line of November 2021.
Resume
The reality at the moment is that Cryptocurrencies is a helpful factor for much kind of deals in Ukraine and Russia. No one should have any doubts about that, as the numbers and the price action in Cryptocurrency Market, proving the word of truth.
The fact that Russia gets suspended from Swift Transactions is finally a positive catalyst for Cryptocurrencies.
Fundamentals and news can control the direction of Technical Analysis too. Investors and Traders do not have the luxury to ignore those two factors at least at the current moment.
A continuation of sanctions against Russia and a possible continuation of the War in Ukraine can support the price action of Cryptocurrencies and Investors to see much highest price in the future.
Taking in account all the parameters, news, fundamentals and technical analysis, we are expecting for monthly prices action for Bitcoin, Ethereum and Litecoin, as follows:
Bitcoin Price Action Expectations
The fact that Bitcoin Price Action is unsustainable is something that needs to worries us. Apart from this is clear that Bulls they will try this month to find support above $46,500.00 area. They must recapture the 13 Moving Average, they must stabilize the price above $46,500.00 and at the same moment to break above the yearly Bearish trend – line of April 2021. In general and based on historical data, April is a bullish month for bitcoin, but we need to remain cautious until the above factors get clarified.
The fact that Bitcoin price Action is unsustainable at the moment, exist a very big reason behind this factor, something that may we can analyze and explain in a new separate article.
Ethereum Price Action Expectations
As we mentioned above, Ethereum shows more Bullish Momentum than Bitcoin at the moment. The probability to see a consolidation actions between Fibonacci Golden Ration Support and Resistance it exist. In case that Ethereum manage to find support above the 13 Moving Average (At the moment it is above), then we can expect the Bulls to take action and to see prices around $5,000.00 again.
Litecoin Price Action Expectations
For Litecoin, our opinion is clearer. Our expectations is to see the price of Litecoin at least near $180,00 during this month. Exist the serious resistance at the area of $156,00. In case we saw the bulls breaking above this area, then prices between $180,00 to $200,00, is very reasonable and possible.
As always, it is clarified that you need to make your own research before to proceed in any possible Cryptocurrencies investment.
